DON’T HAVE TIME TO READ THE ARTICLE? DON’T WORRY, LET ME SEND YOU A COPY
Do you work between PowerPoint and Excel, importing tables and graphs for presenting data in PowerPoint, such as business or analytic results?
I did so when I was working for a multinational company in FMCG. I decided to write this guide as a summary of everything I wanted to know when I was in your shoes, about presenting data in PowerPoint.
Analytics are the base of the strategic decision-making in structured organizations. In business, I believe that you should always use all possible data before making a decision on investment. For example, the most structured organizations have roles dedicated to analyzing and presenting performances.
Nowadays, the hunger for data to support decisions is transversal and affects practically every company function, from line functions to staff functions.
I often work with people in roles such as finance or accounting, who send me complete presentations made exclusively from charts and tables.
They certainly don’t want to add some images to make their tables more appealing!
What are they looking for?
They look for visual effectiveness and communication strategy, because behind a table or a chart, there are messages that could support stakeholders in making one decision rather than another.
Presenting data in PowerPoint can often make the difference between success or failure.
If, until now, you thought that your role only included numerical presentations and therefore Lean Presentation Design cannot help you, this guide will change your mind.
A presentation made of tables and graphs can be boring, lack design of the visual path (where would you like people to look?), may be missing an information hierarchy, or simply missing a story, therefore, missing an appealing flow.
Among the many methodologies of data storytelling that you can find online, there is one that has a very close approach to Lean Presentation Design, and it is the Cole Nussbaumer Knaflic.
We can learn from her methodology of effectively presenting data in PowerPoint and improving the strength of your presentations.
In Data Storytelling, Cole presents an optimization process of any chart or table based on 6 simple steps (the book is obviously available on Amazon):

Step #1: Understand the Context
Before you even think about graphs, numbers or tables, you need to understand the context in which you operate. The first fundamental distinction is between exploratory analysis and explanatory analysis.
Usually in a process of analysis, synthesis and presentation of data, the phase in which you are presenting is the last one, in which you should expose the results of your work.

The analysis often begins with the exploratory phase. In fact, doing data analysis is a bit like looking for a needle in a haystack: digging through reports, crossing numbers and trying to identify a pattern or insight that allows you to identify or understand the dynamic of a problem, and then make a forecast.
Cole compares the analysis of the data with a search of pearls in shells: to find one, you probably have to open a hundred oysters, and this takes time and effort.
When we do a hard job, we often forget to present the whole process to support the final discovery, as though you were telling the story of all the time spent in the haystack to look for the needle and all the corners where you looked without success, without finishing the story.
However, your role is to manage this complexity and present only the solution, not all the work that was behind it. Otherwise you will make the presentation unbearable and extremely tiring for those who listen to you, who will then experience the same frustrations you suffered during the research activity.
Presenting in PowerPoint, you have to share the synthesis and shed light on the discoveries without wasting time, thus focusing on what Cole defines as the explanatory analysis.
If you have already read the guide “How to create effective tables in PowerPoint“, it is the same consideration I was explaining, in that you don’t need to show all the steps necessary to get the number you want to present but focus on “actionable numbers”.
By “actionable numbers”, I refer to all the numerical data you need to support the recommendation you want to give the audience.
In short, use only the numbers that you need to convince them to take the decision you want them to take. Remember that your role, as a presenter, is to recommend one decision over all others.
To convince who? To do what? And how do you plan to do it?
These are the three fundamental questions you must answer to contextualize your presentation with respect to the people you are facing while presenting data in PowerPoint.

The first step when you prepare a presentation, is to know the people listening to you well (WHO). Cole says that it is not enough to know the job title or their role in the organization and I agree with that.
According to what Peter Cougher, author of the bestseller “The Art of Pitch“:
It’s a difficult task to know your audience at this level of detail, right?

This is a reading that I highly recommend if you are willing to do a presentation in public for your work (see the book on Amazon).
In my opinion, all you really need to know about your audience are the reasons behind their resistance to change.
In Change Management, we talk about resistance to change, referring to all the stakeholders within the organization who oppose a potential change.
After all, we know that people don’t like doing something different than what they’ve always done, because it means getting out of one’s comfort zone and that makes them uncomfortable.
The discomfort often arises from the need to make the right decision (WHAT). In business, the stakes can also be very high and the decision can therefore be difficult to make.
Think of a startup presented to investors to raise funding. Investors are desperate for quality projects in which to invest and multiply their earnings.
What happens if they invest in the wrong startup?
In most cases, they lose their investment.
So, investors want to be sure before making such an important decision. They obviously cannot predict the future, but during the pitch presentation, they will probably try to figure out if the project aims at an interesting market, if the team is solid, if a useful problem is solved, if there is any evidence of the fact that people would pay to solve the specific problem, etc. (View the ultimate guide to creating a brilliant startup pitch presentation).
All these doubts must be clarified by those who present, otherwise they will, almost certainly, be the subject of questions and discussions.
In general, all these reflections are the obstacle that exists between the startup and it’s financing, hence the reasons that prevent the investor from making the investment decision. I call them, “Resistances”.
Why are Resistances so important?
Simple. If you know them, you can overcome them by including answers strategically within your presentation (see the Act strategically in your presentation with the Lean Presentation Design approach).
If you are able to overcome audience resistance during the presentation, you will have a good chance that your recommendation will be accepted.
Once you have clarified the action that you want your audience (WHO) to undertake following the presentation (WHAT), you are able to define a communication flow that allows you to overcome the resistance and communicate effectively (HOW).
Okay, I must always have a goal. Can’t I present just to inform?
I believe that a good presentation always has a goal and therefore a final call to action. Cole points out that, in certain organizational contexts, you may not be in a position to tell your superiors what to do, but that does not mean that you can’t propose a moment of discussion supported by the results of your analysis (and this could be your call to action).
I invite you to observe that all this is true, whether you are presenting in person or whether you are sending the document by email.
What changes is the level of detail in the contents.
If you present in person (live), you will have a greater control of the situation, as you will directly manage the interaction with the audience, and therefore you will need much less detail.

Can’t I take advantage of the slides to remember what I have to say later?
Absolutely not!
There is nothing worse than a speaker who does not know his speech and reads the side in front of everybody. What do you think every time someone reads his slides in front of you?
Do I have to memorize all the presentations I make?
No, after all it would be a hard work and I think that for many, it would be unsustainable. For example, I would have to undertake a huge effort to memorize a presentation.
Also, consider the moment when you are presenting, regardless of your ability to speak in public, as a moment of stress.
Under stress, memory is the first ally to abandon you. You may find yourself in front of your audience without remembering what you have to say.
For this reason, I suggest you never learn the presentation by heart.
I personally support myself a lot with the PowerPoint presenter view mode.
Do you know how the presenter view works? I find it brilliant!
There were events where I cancelled the presentation due to the absence of the possibility of using this method.
With this mode, PowerPoint projects the current slide on the projector, and on your laptop; this allows you to see both the projected slide and the next one.

Knowing what comes next, it is easy to anticipate and give continuity to the speech. Anticipating the next slide, you will communicate security and ability to lead the discourse, unlike all those speakers who seem to be guided by their own slides.
So, prepare well, because you should have enough information at a glance on the presenter mode to continue talking; you certainly will not stop to look at the screen of your laptop in front of everyone. But do not memorize the presentation, it is both useless and far more risky.
It may happen that you arrive in the meeting room ready to project and come across an instrument called clickshare. When you start the wireless connection with the clickshare, you will not be able to start the presenter view mode and on both the screens (pc and projector), you will see the same slide.
If this is the case, do not despair. I found a simple enough solution to activate the presenter view even if you present with clickshare (Enable Powerpoint presenter view using clickshare).
So, focus on your audience, understand their resistance to your proposal, and define a communicative flow valid to overcome them without leaving any doubt.
Step #2: Choose an appropriate view
Cole focuses on 12 ways of presenting data in PowerPoint, commenting on those I think are more frequent in presentations and thus you may meet more frequently.
Simple text
If you have any numbers to present, it does not mean that you necessarily need to use a chart or a table.
Especially when it comes to small numbers, a good alternative is to play with text graphics and take advantage of the typography to solve the problem.
The following example is comparing how many users use the Instragram Stories compared to Snapchat (the numbers are for example).

At the top of the graph you will find a title and a subtitle, and below the graph you will find a comment explaining the message.
I’ll ask you a question: if you need all this text to explain the message, do you think the chart may not be sufficiently explanatory?
The alternative is presenting data in PowerPoint only using text, intelligently formatted.

Thanks to the use of the text, I immediately made the key message clear. I also synthesized the two numbers and highlighted their difference.
I hypothesized that the message was to communicate the strength of Instagram compared to Snapchat and thus, it was not important to keep absolute numbers.
I also highlighted some keywords that made the message stand out right away.
Table
Do you ever have tables in your presentations? When I was working in the marketing of a multinational in FMCG, it happened to me every day.
Ideally, it is not advisable to use tables within presentations, but my approach is very pragmatic and coming from the business world, I realize that it is a problem to be faced, not to be avoided.
For this reason, I dedicated one of my most read blog guides to this topic: How to create cool PowerPoint tables.
Cole simply suggests cleaning the tables as much as possible by highlighting the contents and eliminating edges and fills as much as possible.

I fully agree with the need to be able to focus on the contents and remove all the disturbing elements.

Heatmap
Excel allows you to apply conditional formatting to tables.

This is a good technique for quickly locating the highest or lowest numbers within the table. The colors will guide you.
I often find myself presenting data in PowerPoint leveraging Excel‘s conditional formatting, especially in the exploration phase. That is when I analyze the data to find explanations for the events.
They help me extract the message from the numbers right away, and will help your audience understand you at a glance.
Scatterplot
A widespread graphic in the scientific and business fields.
It is mainly used to show the correlation between two variables such as, for example, the correlation between the price of lemonade and the temperature.
In this case, it would be really difficult to understand the correlation between these numbers by analyzing the table.

By plotting the numbers on a Scatterplot, the reports become clear at a glance.
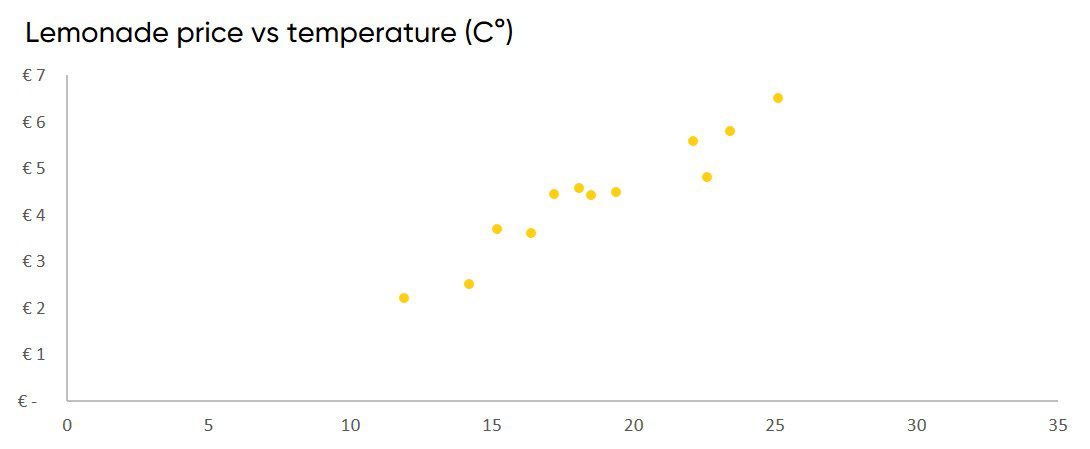
The graph suggests that the price of lemonade grows as the temperature increases.
As you can see, this type of chart can be very useful even during the exploration phase, not just during the presentation phase.
Line
Line charts are useful for comparing multiple sets of data that evolve over time.
Take the trend of the market shares of a group of competitors.

Line charts can also be optimized by applying a series of small details that we will see later in this article.
Slopegraph
Graphic that I have never seen in a presentation so I avoid commenting on it. If, however, you should be interested in further reading I recommend reading Cole’s book.
Bars
A family of numerous charts with different types all very common in the business world and in presentations in general.
First of all, Cole is keen to underline the ethical use of this type of graphics in communication.
If you’re wondering how a chart can be used in an unethical way, that’s exactly what I asked myself the first time I read Data Storytelling.
I found this concept curious and that’s why I want to show it to you.
Imagine having two bars representing two percentages. I could tell you that the change from A to B was radical and brought an important increase.

However, if you look carefully at the axis of the ordinates, you immediately realize that it does not start from zero and this means that the difference between the two bars is much more pronounced.
What happens if I report the ordinate axis on a scale that starts from zero?

The difference between the two bars is greatly reduced.
Clearly, it is up to you to understand when and how to use this technique, Cole invites caution and exposes a rather curious example used in US politics in the second chapter of Data Storytelling.
The vertical bar graph is one of the most common to meet in presentations.
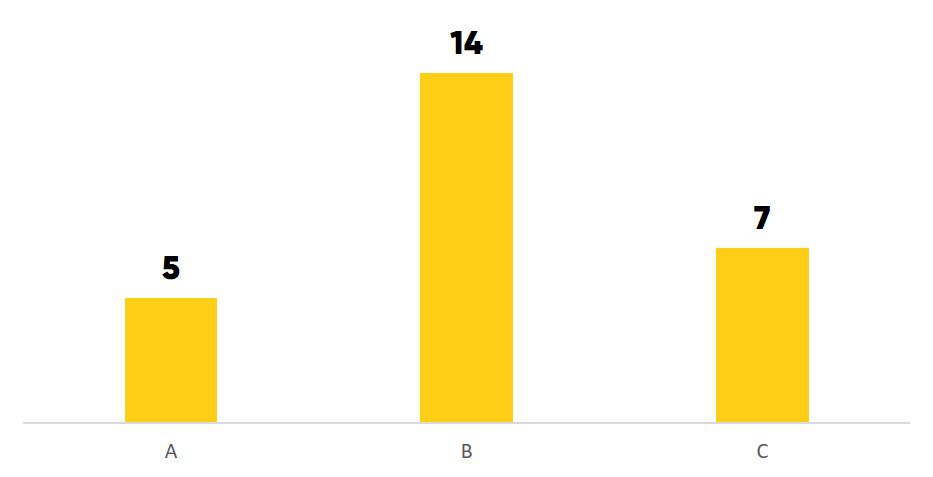
It works very well because it is easy to determine the length of one segment compared to another. The chart becomes more complex when you add more categories.

Another fairly common but more complex readability chart is the graph called “Stacked vertical bar“.
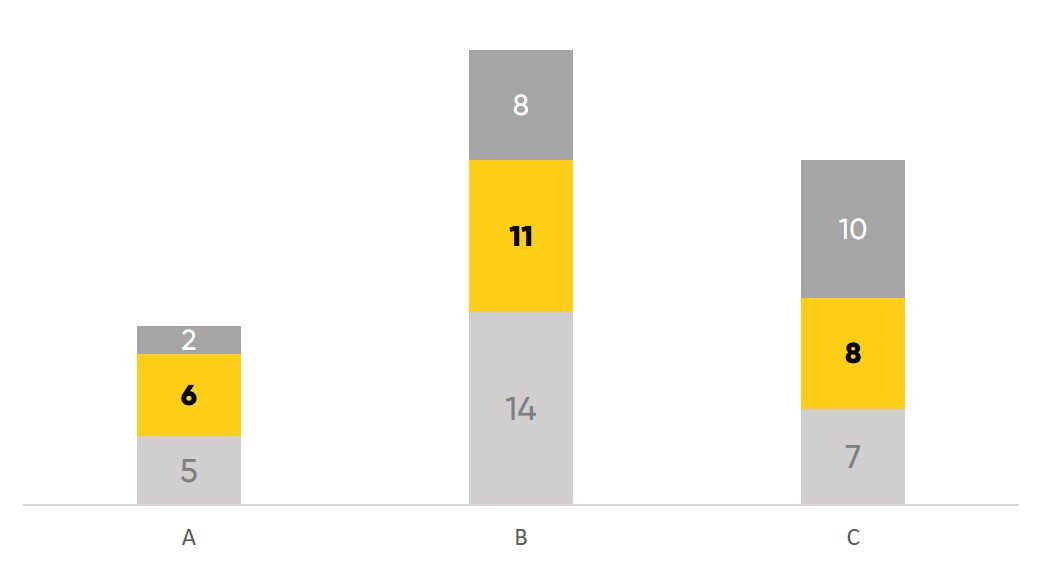
Cole rightly points out the difficulty in comparing the segments with each other and I find myself in complete agreement.
These graphs can also exist in a horizontal version. Specifically, Cole claims that the horizontal bar graph is to be preferred over the vertical bar chart because, people read from left to right and they are therefore easier to process.
I add that we, as human beings, are horizontal readers, and thus it is easier for us to read from one side to the other than from top to bottom (at least in the part of the world where I am). Given the importance of learning to lead the audience‘s gaze in your slides, I spent some time doing eye tracking studies on presentations and published the results in the guide that explains how eye path control can dramatically improve presentations.
Finally, the dreadful waterfall chart, a nightmare of all first-time analysts for its complex feasibility through office apps over the years, cannot be missed.
In reality, today it is very easy to carry out both in Excel and in PowerPoint.


One of the use in which I happen to see it often are long-term strategic plans, in which each category corresponds to one year and this chart shows the increases in performance from year to year.

There is also a PowerPoint addin historically known to facilitate the creation of Waterfall, called ThinkCell. See the video below.
Square area
Cole says that almost no area graphics are used, except for rare exceptions, because they are hard to read. I fully agree with the point and add that I almost never find them in a presentation. So let’s proceed with the next example and if you are curious, I encourage you to read Cole’s book.
Pie Chart
How could it be that I’m just now talking about the pie chart? Didn’t you expect it to be among the first covered?
The reason is simple and is related to the fact that Cole does not fully endorse this type of chart.
Look at the cake below and tell me what the biggest slice between C and D is, in your opinion?
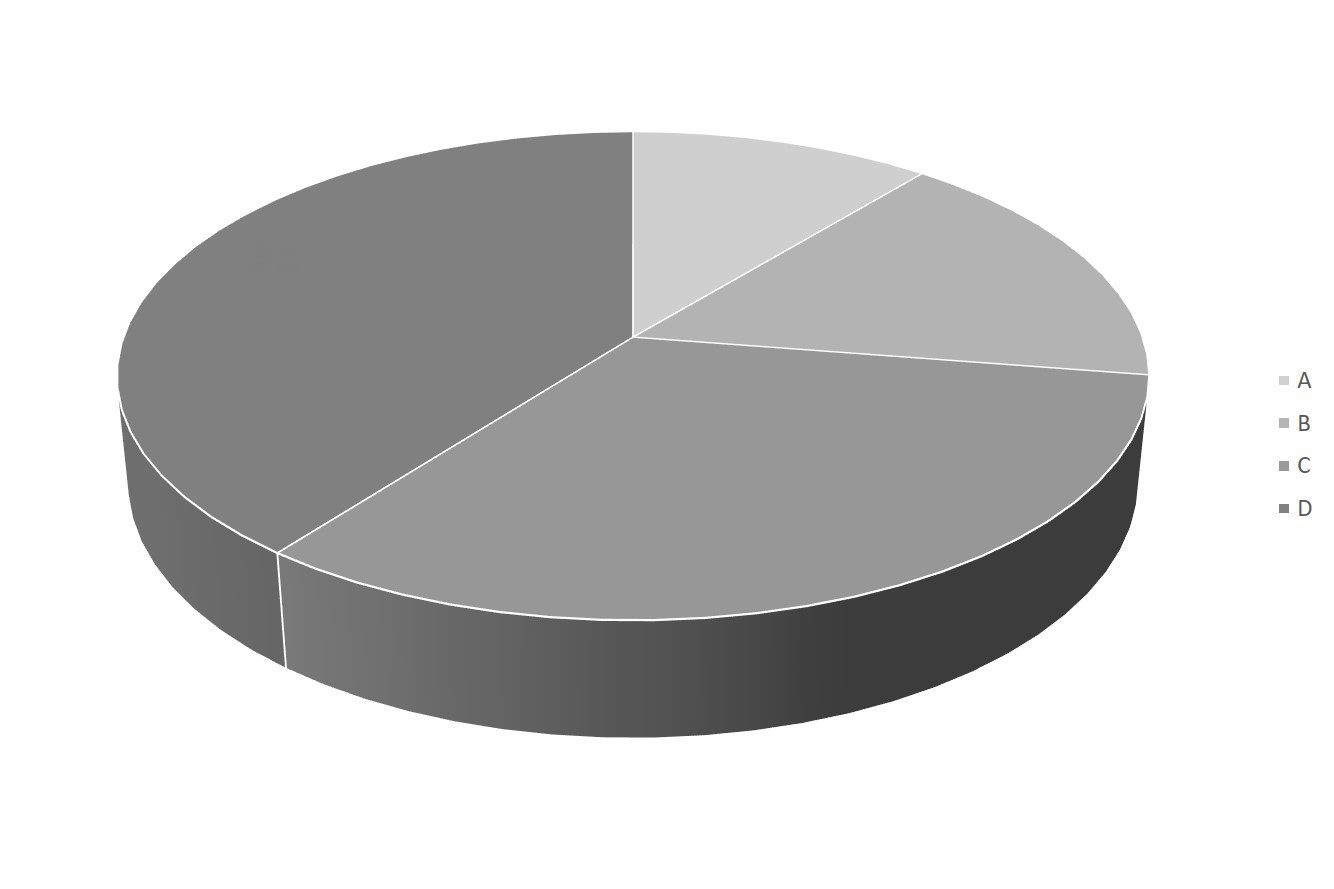
The question is not difficult, it is the answer that becomes very difficult in a situation where you can not match one segment with another unless you insert the data labels on the slices.

For this reason, Cole suggests not using 3D, and I add that 3D is a concept that should be forbidden in presentations in most cases. It does not add value, it wastes time and the results obtained are always mediocre.
If we look at the above chart in 2D, it becomes easier to identify the smaller slice, in my opinion.

For this reason, unlike Cole, I do not completely exclude the use of pie charts, but I invite you to use them, always making a check that you can clearly perceive the relationships between the slices (which is bigger).
One last comment goes to the management of the secondary axis, but I will comment it only if you ask about it in the comments of this post. The first one who requests it in the comments will have an explanation and a recommendation.
Step #3: Eliminate the confusion
You are monitoring the performance of your company’s market shares compared to the two main competitors in the 4 quarters of the year just ended.
A and B are the competitors with whom you compare. To better visualize the context, I decide to plot the table using lines.

Does this chart seem clear to you?
If you think about it for a moment, this is exactly the default result that Excel returns to you when you chart that table.
How can you optimize it to improve its visual effectiveness?
Begin by removing the edges of the graph that do not add any value and generate noise.

In the same way, remove the grids.

See how the lines already stand out compared to before, when they seemed to be caged in the grid?
Eliminate markers that do not add any value. As Cole rightly points out, markers are not forbidden and we are not recommending you to always delete them, but to use them only when you really need them.
To delete them, you must change the type of chart.

The result is a much cleaner and slimmer chart.

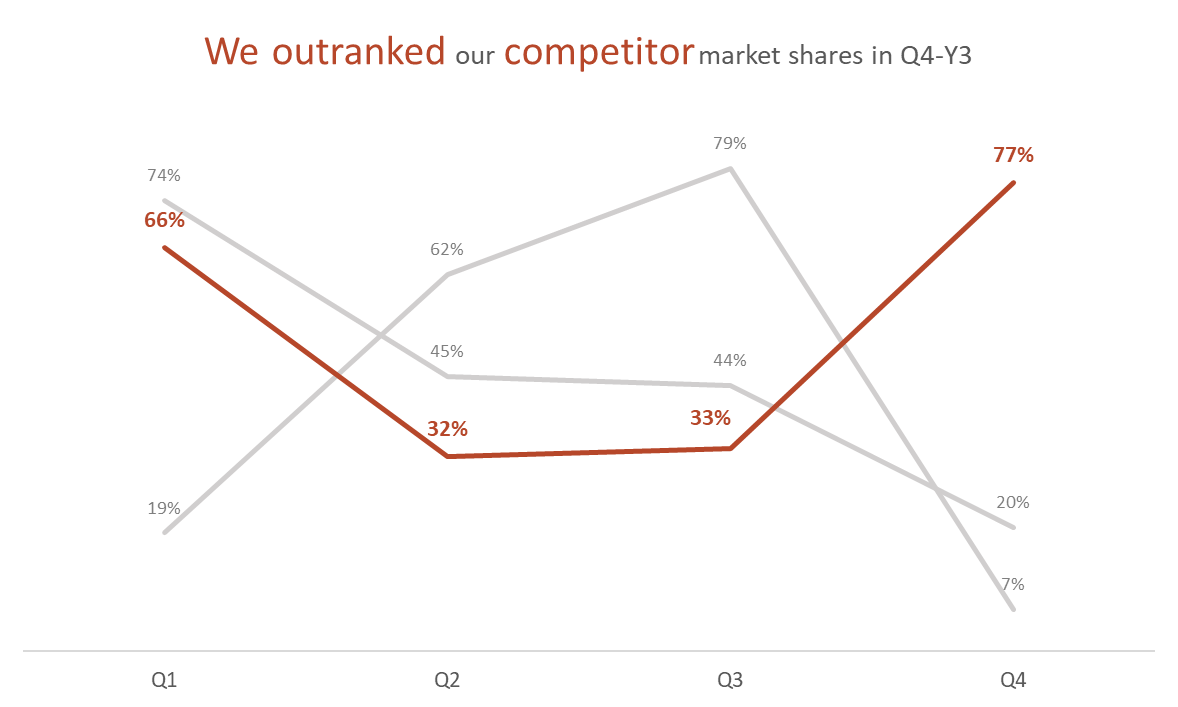
Now, apply a color that highlights your company over the others.

Emphasizing your company is essential to put the line at the center of attention, but A and B that have remained the background are now virtually indistinguishable through the legend.
Also, reading the legend below and then taking your eyes back to the right curve on the chart is a waste of time.
Do not let the eyes of your audience search, make sure they already have the information close and easy to find.
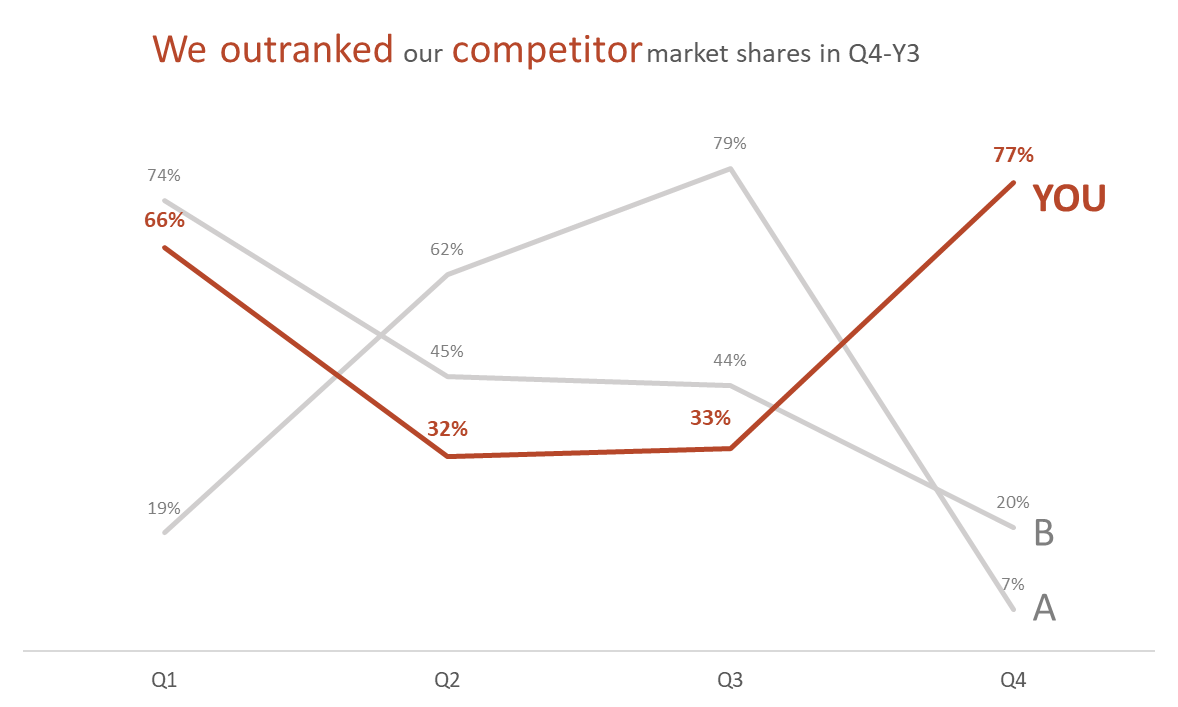
Give the lines the name, consistent in color, positioned at the end of each line. By doing so you could also eliminate the legend that did nothing but add to the confusion.

Finally, add the numerical labels and delete the ordinate axis.

Make consistent colors, which link numbers, lines and text labels.

Have you seen how, a few simple tricks, can radically change the readability of a chart? I’ll let you compare the “before” and “after” with the next image.

Clean up your charts following the same logic as Lean Presentation Design: use only the elements that are used for communication, eliminate embellishments.
Step#4: Draw attention wherever you want
The attention of the audience is mainly attracted by the contrast that you can create, for example but not only, with an intelligent use of colors.
As part of this example I have kept the focus on your company by highlighting the curve over time thanks to the application of the main color.
If instead I wanted to talk about the explosive growth of competitor A, how would you have been able to draw attention to its curve?
You could have created a strong detachment thanks to the use of the complementary color to the main orange.

In this example, we can clearly see, like the same graph, the same numbers, can be presented according to certain messages according to the elements that are being highlighted. I’ll let you read Cole’s book which extensively illustrates various techniques to create visibility around certain elements rather than others.
Step#5: Think like a designer
In 1979 James Gibson in “An ecological approach to visual perception” defines the concept of “Affordance” (invitation to use) as the physical quality of an object that suggests to a human being the appropriate actions to manipulate it.
A small cup with a side handle suggests holding the handle as a floor suggests walking on it.
Basically, every object, if properly conceived should not leave doubts about its use.
When you optimize the user experience in your presentations thanks to Neuro Presentation Design you are making slides so intuitive that they could not be understood in any other way.
Can you do the same thing on the charts?
I would say yes!
Look at the chart we’ve drawn previously

Is the way in which it is to be read absolutely clear? That is, is the message revealed at a glance?
In my opinion, not yet.
Try to reprocess the title as follows.

Take advantage of the main color to create contrast and similarity (How to take advantage of 4 basic design principles to dramatically improve your presentations ).
Finally, Cole suggests using the principle of alignment to create uniformity and cohesion in the chart lines.
For you this translates into the alignment to the left of the title.
Unlike the previous step, thinking like a designer means designing with the needs of the end user in mind.
The goal is to draw so well that you do not leave doubts about the message you want to pass.
Step#6: Tell a story
By now it is quite recognized that stories have an enormous communicative force in the world of communication.
To be precise, I do not share the idea of always introducing a story within each presentation. Now we see presenters entering the meeting room and telling personal stories, jokes, etc. Thinking this is essential to awaken the audience at the beginning of the presentation.
Although it is certainly correct to try to grab the audience at the beginning because after a few minutes it may already be too late.
The real strength of the stories lies in their narrative structure that, if applied to a presentation or a chart, makes the difference seriously (Storytelling techniques for presentations – Bosch case study).
Cole and I use two different storytelling models, but we both agree on the main elements behind an effective narrative structure:
- introduction of a context and a protagonist
- presentation of the crisis, of the problem that forces the protagonist to undertake a path of change
- development of the plot that forces the protagonist to acquire new skills or create a new perspective to solve the problem
- final part of the story
How does this apply to the world of graphics?
Simply telling the facts in the footsteps of an interesting narrative thread.
Follow me that I show you the example.
Initially you could introduce the context of your company that is not going very well compared to its competitors and that there is one in particular that is growing in a worrying manner.

In reality, competitor A only grows for the launch of a new advertising campaign and you feel that the effect will not last long. Your company, on the other hand, has no structural flaws for which it should cede further market. In fact, already in the second quarter we can see a stabilization of the shares. For this reason you propose to stay focused on the long term and to ignore peaks in the short term.

The long-term strategy gives you reason and rewards

In summary I used two more slides with the slightly modified graph (in PowerPoint) to tell you the story of what happened.
Conclusions
Charts and tables can be phenomenal tools to presenting data in PowerPoint. However, they are often used inefficiently and this causes frustration in the audience and the ineffectiveness of the communication itself.
In Data Storytelling, Cole offers a methodology that goes well with the Lean approach to presentations.
The approach is based on 6 steps of optimization:
- Understand the context
- Choose an appropriate view
- Eliminate the confusion
- Draw attention wherever you want
- Think like a designer
- Tell a story
Have you already tried this methodology to better presenting data in PowerPoint? Let’s leave a comment, then we’ll talk about that.
Sources
5 Clever Ways to Present Data Effectively in PowerPoint
7 Data Presentation Tips: Think, Focus, Simplify, Calibrate, Visualize++
5 Tips For Better Data Presentation
5 Commandments for Presenting Data in PowerPoint
Presenting Data in PowerPoint |PresentationLoad Blog
Creative ways of presenting Data in PowerPoint
Presenting data in PowerPoint and Prezi
Creative ways of Presenting Data in PowerPoint Presentations
Comments on The definitive guide to presenting data in PowerPoint
Free PowerPoint Templates
If you looking for descriptive PowerPoint shapes or tables then these are some of the best one.
Maurizio La Cava
thanks for sharing. Please identify your guest post with a picture or it will be removed.
A.Savarimuthu
Good and informative .
Simple to understamd